
Poking the Angry Beast: How do we know?
by Jess Spear
If you look at a map of the world you’ll notice that the west coast of Africa and the east coast of South America look like complementary puzzle pieces. Indeed many of the world’s coastlines appear as if they were once side by side. It was this observation that led scientist Alfred Wegener to declare,

“The continents must have shifted. South America must have lain alongside Africa and formed a unified block which was split in two in the Cretaceous; the two parts must then have become increasingly separated over a period of millions of years like pieces of a cracked ice floe in water…”[1]
In 1912 Wegener first presented the idea of continental drift, whereby the continents slowly creep around the earth, crashing into each other and ripping apart over time. In addition to the close fit of the continents, fossils recovered on what are now different continents, separated by big bodies of water, strongly indicated that the same plants and animals (and even their parasites) had lived in close proximity. Science historian Naomi Oreske remarked how “[t]he earthworms’ distribution seemed to be particularly significant, because earthworms can neither swim nor fly, nor do they have resilient seeds or a dormant life-cycle or free-floating larval stage, which could permit passive distribution.”[2] At the time Wegener was working, scientists hypothesized that land bridges must have existed, allowing species to migrate from continent to continent, but then eroded away over time.
Article originally published in Issue 2 of Rupture, Ireland’s eco-socialist quarterly, buy the print issue:

Winter 2020
Special feature: What the health?
It doesn’t have to be this way: Crisis in the care economy & the role of the state, by Jess Spear
A system in permanent crisis, by Diana O’Dwyer
Mental health epidemic, by Kay Keane
The right to transition: Trans healthcare in Ireland, by Roisín O’Shea
Big pharma & the search for the vaccine, by Dave Murphy
Severed: the metabolic rift between humans & nature, by Des Hennelly
Down in the dumps, by Nicole McCarthy
Habitat destruction, by Alan Horan
Factory Farming, by Ross Davidson
Here to stay: health workers have entered the arena of class struggle in Germany, by Daniel Behruzi
Features:
Three meals deep: An interview with Fergal Anderson of Talamh Beo, by Des Hennelly
Energy Vacuums: Data centres, renewable energy, & rural politics, by Patrick Brodie & Patrick Bresnihan
‘The world was ours to create’: an interview with Helena Sheehan, by Brian O’Cathail
The struggle against fascism, by Clara Zetkin
What is to be done?
Unifying a divided working class: the national question in Ireland, by Paul Murphy
Off the sideline, by Diarmuid Flood
Can we build a broad & pluralist party of the left? by Aprille Scully
Rupture Regulars
Poking the angry beast: How do we know? by Jess Spear
Lesser-spotted comrades: Claudia Jones, by Jess Spear
Gaslighters, Ghouls, and Gobshites
Note: Orders from Northern Ireland also qualify for free shipping but our e-commerce system requires you to keep the country category as ‘Ireland’ at check out.
Three years later, Wegener published his theory in The Origin of Continents and Oceans. Drawing on many different sources of evidence, Wegener proposed that the continents once comprised a supercontinent which he called Pangea. In addition to the data from fossil plants and animals, Wegener noted how rock formations that ended at the sea re-emerged on a shore far away. For example, the Giant’s Causeway in Northern Ireland and Fingal’s Cave in Scotland were formed at the same time roughly 60 million years ago and then split apart. The Irish myth of the giant Fionn mac Cumhaill building the bridge between Ireland and Scotland shows how people long ago understood that similar rocks in different places must mean they were connected in some way.
Yet, Wegener’s contemporaries largely rejected the theory of continental drift. They didn’t buy that the jigsaw fit and abundance of palaeontological data was proof that the continents moved. As Oreskes explains, “the resistance of many geologists led Wegener to conclude that indirect reasoning was insufficient. One needed direct proof. One needed to see the thing happening.” So Wegener went on to measure the westward movement of Greenland where he was also busy setting up meteorological stations. But it wasn’t until more data was collected after his untimely death that his theory was generally accepted.[3]

Atolls are islands formed by coral reefs that once ringed an undersea volcano that has since eroded or sunk away.
Today continental drift and plate tectonics are used to explain a whole range of phenomena from mountains, earthquakes and volcanoes to atolls (like the Maldives) and islands like Hawaii created by hotspots.[4] It’s how we “know” that continents have collided over millions of years, forming mountain chains like the Himalayas, which formed when India crashed into Asia 40 million years ago. Over many more millions of years, they then break apart, as new ocean basins are born like we’re currently witnessing in east Africa. Continental drift also explains how Ireland has a nearly 1 km thick layer of limestone full of marine fossils in the Burren, which formed over 300 million years ago when our geographic location was closer to the equator.
All that we know about earth’s history, from its beginning 4.5 billion years ago and the ice ages of the last 2.6 million years to today, we know from studying the earth itself. The rocks, fossils, and chemical fingerprints left behind are clues to what happened, when it happened, and how it happened. Similarly, alterations in climate, big and small, are recorded in the air bubbles captured in glaciers and ice sheets, in the width of tree rings, and in the shells of marine organisms. These climate ‘proxies’ are used by scientists to reconstruct past conditions and tease out the various factors that affect climate (see box: Climate Proxies).

Pollen grains can tell us what plants were abundant in the past, helping us to reconstruct past climate.
Unprecedented
This is why, when we look at reconstructions of past CO2 concentrations in the atmosphere, we know what’s happening now is unprecedented in two ways.

Fossil leaf of Ginkgo biloba help us recontruct the CO2 concentrations in the ancient atmosphere.
Firstly, never in the history of civilisation (10,000 years) or indeed not even in the history of humanity (300,000 years) have we lived with so much CO2 in the air. Our certainty about that is pretty high because we can literally sample ancient air trapped in the ice sheets in annual layers. A record spanning the last 800,000 years from the Antarctic Ice Sheet shows that CO2 levels fluctuated between roughly 190 to 300 ppm (parts per million, so for one million air molecules, 190 are CO2). Today it is well over 410ppm. The last time it was this high was at least three million years ago, when the earth was around 4 degrees hotter and sea level was 25 metres above today’s shoreline.
There were periods in the earth’s deep past when the CO2 concentration was considerably higher than today. Two hundred million years ago as Pangea was breaking up and long before Tyrannosaurus rex reigned, the concentration of CO2 in the atmosphere was perhaps four times higher than current levels. Global temperature was about 6 degrees warmer and there was no permanent ice on land. In other words, the continents, life, and climate was nothing like today or anything we’ve ever experienced.
Secondly, the current rate of change is incomparable to anything scientists have uncovered in earth’s history. This is the most alarming aspect of what the earth’s record tells us. In 2018 the Intergovernmental Panel on Climate Change (IPCC) reported that “[t]he rise in global CO2 concentration since 2000 is about 20 ppm per decade, which is up to 10 times faster than any sustained rise in CO2 during the past 800,000 years”.[5] Adding 20 ppm per decade means we could see CO2 concentrations reach 500 ppm before the end of the century, a concentration not seen in the last 20-30 million years.
Climate Proxies
Knowing what came before, how the earth changed over time, and importantly why it changed, can help us predict what will likely happen in the near and distant future. The more we discover how bacteria, fungi, plants, and animals interact and exchange materials with their physical envrionment, the more we can apply that understanding to the past to uncover what happened. The present is the key to the past and the future. By combining knowledge of chemistry, physics, and biology, scientists learn to read earth’s history book.
For example, plants have special cells on the surface of their leaves, stomata, that take in CO2 and release oxygen and water. The number of stomata on the leaves depends on the CO2 levels in the atmosphere[19], the more CO2, the fewer stomata cells. Scientists can therefore look at imprints of ancient leaves, so well preserved you can actually count the stomata, and determine the CO2 levels in the past.
Or take oxygen, an element found throughout the environment, in the air, the rocks, the soil, our bodies (helping construct new cells and replicate DNA), and of course water. It’s nearly everywhere, making it a useful tool to study changes in different areas of the earth system. Scientists track the movement of different kinds of oxygen (heavier versus lighter) to uncover for example changes in the strength of the monsoon season and the growth and decay of ice sheets and glaciers.
The oxygen found in the fossil shells of microscopic marine organisms called Foraminifera is commonly used to reconstruct past climate change. As these single-celled organisms build their shell they record the chemical makeup of their surroundings. (Scientists can also use this on humans as we too take in oxygen isotopes in our bones and teeth!) After a very short life of weeks to a few months, their micro shells end up buried in mud on the seafloor and over thousands to millions of years, bit by bit, these mini time capsules preserve a record of ocean conditions. Paleoceanographers (scientists studying the ancient ocean) collect cores of the seafloor, wash away the mud and examine the ancient shells.
Other climate proxies used include corals, stalagmites from caves, pollen, sponges, and even leftover bits of microscopic algae found in the seafloor. They tell us whether there were lots of nutrients available for growth or not enough, what trees were in abundance, the rainfall in the region, whether the water is becoming acidic, and if the temperature plummeted. Like Alfred Wegener before them, climate scientists use multiple sources of evidence, data collected from different proxies responding to changes in their environment, to get a fuller picture of what really happened and why.
What can we expect?
How much warming, extreme weather, and sea-level rise can we expect from the gargantuan quantities of CO2 injected into the atmosphere year after year? In other words, how sensitive is the climate system? If you poke it with a big stick, what usually happens? This is a very tough question for scientists to answer because the earth is extremely complex.
To start we can look at past fluctuations in CO2 and temperature before capitalists dug up and burned loads of fossil fuels. Scientists look at the transition from the iciest part of the last ice age (around 20,000 years ago) to the beginning of the warm period in which we’re currently living because it’s well studied and the factors affecting climate are generally well known.

Foraminifera shells are used to reconstruct past ocean conditions such as temperature and salinity.
We can measure the CO2 directly from the ice, but for temperature, we have to rely on climate proxies like Foraminifera. These microfossils have been collected from deep-sea sediment cores from all over the world, thereby giving us insight into ice-age temperature globally. However, the temperature records are not perfect and each one has an amount of uncertainty to it, which scientists account for and report.
We also look at current changes such as the increase in temperature since the industrial revolution alongside the rise in CO2, changes in land use, ice loss, and so on. How much the land and ocean surface warms can depend on a range of factors - clouds can have a pretty big impact on temperature and are notoriously hard to model. Data from the past and observations from today are combined to create climate models, which are then tested to see how well they can predict what happened in the past (known as hindcasting). How well they match up with observations gives us a sense of how accurate the predictions will be.
““CO2 concentrations could reach 500 ppm before the end of the century, a level not seen in the last 20-30 million years.””
Let’s say I wanted to predict what you will eat for dinner next year. I could take information from all your past meals combined with all the factors that I think most impacted your decisions, where you’re from, your culture, the weather, how much money you had, were you in a relationship, how often you watch tv and come into contact with advertisements, and maybe also food fads. The model I create of your food choices could then be tested against all your past, known food choices. If my model predicted you ate spaghetti bolognese 52 times last year and you only ate it 26 times, well then my model’s predictions about what you will eat in the future are not likely to be very accurate. Clearly, you, a conscious animal with agency, are not a perfect analogy for the climate, but you get the picture.
From all we’ve learned from earth’s history and all we’ve observed over the last 150 years, the best estimate is that a doubling of CO2 concentrations from pre-industrial levels (from 280 to 560 ppm) will result in a warming of between 1.5-4.5 degrees C.[6] However, every year scientists are producing better and better records to reduce the uncertainty in the estimates, to better understand the limitations of the data these estimates are based on, and hopefully produce more accurate predictions.[7]
With all the complexity of the earth system, all the different factors at play, you’d think the models would be way off the mark. But actually, the models for hindcasting and predicting future global temperatures are pretty much in line with what we’re currently seeing.[8]
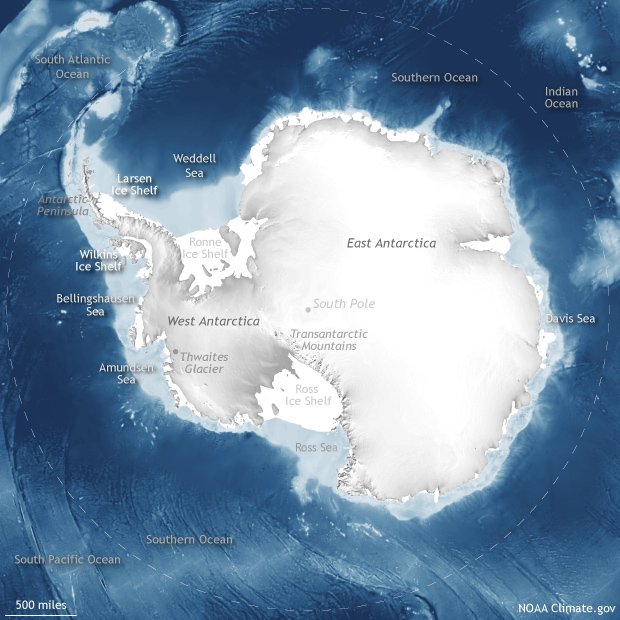
However, for ice sheet melt and sea-level rise, the IPCC predictions have consistently underestimated how fast things are going to change. For example, when I was in graduate school in the early 2000s we thought the West Antarctic Ice Sheet was relatively stable. Ten years later scientists announced it was heading for collapse. Why would that be?
Increasing CO2 in the atmosphere will certainly lead to more heat being trapped. But if you want to predict when the ice sheets will melt, you need to understand what happens to that heat. How much does the ocean take up? How much is reflected back into space? In other words, your starting point matters. How much ice you have, the CO2 levels before things went awry, the area of land covered by forests, and so on affect how the climate system will respond to more CO2 being added.
As former NASA climate scientist James Hansen points out, “[c]limate feedbacks[9] are the core of the climate problem”, both those that respond slowly, such as ice sheets, and those that respond relatively quickly, such as clouds and sea ice.[10] For example, permafrost melting faster than we expected could boost warming from the methane released.[11] Feedbacks are pretty hard to pin down, and it’s why IPCC reports use words “likely” or “very likely” next to predictions.
Additionally, the conservative nature of the IPCC predictions stems from the agreement required from dozens of scientists. Some scientists thought the collapse of the West Antarctic Ice Sheet was “imminent,” while others felt the data didn’t support making such a bold claim. So, in the end, the IPCC report contained “no estimate at all”.[12]
So what can we expect? Really, it depends on what we do.
If we go on as is, the IPCC predicts global temperature will increase another 0.2 degrees a decade and we’ll reach 1.5°C warming sometime between 2030 and 2050. A warming of 1.5 degrees means the ocean will rise by about 50 cm and millions of people will be displaced.
Based on what we now know about IPCC assessments though, shouldn’t we expect that things will be worse than predicted? Already the earth has warmed by 1°C (above pre-industrial levels) and things are pretty bad. Warming in the Arctic is two to three times faster than the global average. The record-breaking temperatures and wildfires in Siberia over the summer are a testament to that. Arctic sea ice is thinning and could disappear in the summer months by 2035.[13] These are feedbacks that will boost warming sooner than scientists projected.
So when scientists say, “[w]e need to come up with a new worst-case scenario for the ice sheets because they are already melting at a rate in line with our current one”[14], we would do well to listen to them. We need to listen to scientists desperately urging that we do all we can to limit warming to 1.5 degrees.
““IPCC predictions have consistently underestimated how fast things are going to change.”
”
Net-zero
After the Paris Agreement in 2015, the IPCC was tasked with investigating the consequences of 1.5 degrees versus 2 degrees of warming, as well as potential pathways to reducing emissions. Three years later, after looking through more than 6,000 scientific papers, they concluded: 1) allowing the earth to warm beyond 1.5 degrees would result in significantly more people in danger and more animals likely to go extinct; and 2) the world must reach net-zero emissions by 2050 if we want to limit warming to 1.5°C.
That 2050 target comes from all the investigations into ancient and current climate change described above. They found keeping warming to 1.5 degrees translated to a carbon budget of just 420 gigatonnes of CO2. We currently emit roughly 40 gigatonnes annually[15], so if we do nothing, we will burn through this budget in roughly 10 years.
Keep in mind that this ‘budget’ only gives us a 66% chance of keeping total warming below 1.5°C[16], and it also requires we remove carbon dioxide from the atmosphere.[17] While you can remove CO2 from the atmosphere through planting more trees, it seems like our shot at limiting warming to 1.5 degrees is largely dependent on technological solutions we don’t currently have.
But what is “net” zero emissions? Net zero basically means the carbon emitted is equally offset by absorption, for example from trees which naturally take in carbon dioxide as they grow, and then release some back to the atmosphere as their leaves fall and decay. You can see the seasonal cycle of carbon uptake and release in the famous Keeling curve that has continuously measured CO2 in the atmosphere since 1957.

However, the problem arises when there’s an emphasis on the ‘net’ rather than the ‘zero’. Focusing on offsetting your emissions rather than getting them to zero essentially gives licence to companies and governments to continue using fossil fuels as long as they simultaneously invest in projects aimed at drawing CO2 out of the atmosphere. For example, airlines claim to offset their emissions through tree planting, but trees take decades to mature and in the meantime won’t be absorbing all that much. But the airline can claim it’s doing good, attracting customers who genuinely want to do their part and helping create a whole new industry now worth half a billion dollars.[18]
We can’t “plant some trees” our way out of this. Fossil fuel emissions must stop altogether.
Act now
Regardless of whether you say net-zero or zero-emissions, when you look at what’s behind the target, it’s clear 2050 is too late. (I don’t know about you, but I don’t want a plan that depends on monster vacuums sucking carbon out of the air and only a 66% chance of survival.) Rather than giving governments a kick in the ass, the deadline is being used to kick the can down the road just a little further. Ah sure, we’ve 30 years to get there, right? This kind of thinking also ignores the responsibility of economically-developed countries, including Ireland, to reduce emissions faster so that underdeveloped countries, which historically have added very little to the problem, can take a bit more time.
There’s still a fair amount of uncertainty about exactly what will happen, how quickly, and how much devastation it will cause. What is clear, though, is that every effort to rapidly reduce emissions now, today gives us a better shot at keeping the warming to 1.5 degrees, saving millions of species and reducing the risk and harm to all of us.
Jess Spear was a research scientist for the U.S. Geological Survey at the St. Petersburg Coastal and Marine Science Center, and then micopaleontologist at the Burke Museum of Natural History at the University of Washington. You can follow her at @jdubspear
Notes
1. Oreskes, Naomi, 1999. The Rejection of Continental Drift: Theory and Method in American Earth Science, New York/Oxford: Oxford University Press.
2. Ibid, p.57.
3. For example, the existence of the Mid-Atlantic Ridge, where new seafloor is born, and areas where it plunges back into the crust along plate boundaries (such as the deepest point on the earth, the Mariana Trench).
4. Hotspots are areas in the middle of oceanic plates where magma (that is, lava that has not yet come to the surface) bursts from the mantle onto the seafloor and creates new land. As the plate moves so does the hot spot, creating a chain of islands. The Canary Islands are also thought to be created by a hotspot.
5. https://www.ipcc.ch/sr15/chapter/chapter-1/
6. See https://www.carbonbrief.org/explainer-how-scientists-estimate-climate-sensitivity
7. https://agupubs.onlinelibrary.wiley.com/doi/full/10.1029/2019RG000678
8. https://climate.nasa.gov/news/2943/study-confirms-climate-models-are-getting-future-warming-projections-right/
9. Climate feedbacks either slow down or speed up warming. For example, increasing CO2 will increase the amount of heat trapped, which will melt ice that normally reflects heat back into space. Less ice means more heat absorbed by the ocean and land, which in turn melts more ice. The feedback here is the melting ice, it acts to amplify warming.
10. http://www.columbia.edu/~jeh1/mailings/2012/20120508_ClimateSensitivity.pdf
11. https://climate.nasa.gov/news/2785/unexpected-future-boost-of-methane-possible-from-arctic-permafrost/
12. https://blogs.scientificamerican.com/observations/scientists-have-been-underestimating-the-pace-of-climate-change/
13. https://www.nationalgeographic.com/science/2020/08/arctic-summer-sea-ice-could-be-gone-by-2035/
14. https://www.sciencealert.com/ice-sheet-melting-is-perfectly-in-line-with-our-worst-case-scenario-scientists-warn
15. https://www.ipcc.ch/sr15/chapter/chapter-2/, section 2.3.2.2 ‘Pathways keeping warming below 1.5°C or temporarily overshooting it’
16. Ibid
17. From https://www.ipcc.ch/sr15/chapter/chapter-2/ “All analysed pathways limiting warming to 1.5°C with no or limited overshoot use [carbon dioxide removal] to some extent to neutralize emissions from sources for which no mitigation measures have been identified and, in most cases, also to achieve net negative emissions to return global warming to 1.5°C following a peak (high confidence).”
18. https://www.cbsnews.com/news/planting-a-tree-offset-your-carbon-footprint/